Life Cycle Assesment (LCA)
An LCA is an assessment of the environmental effects a product or service has during its lifetime, from cradle to grave. In an LCA all the important processes during the products lifecycle is included. An LCA can for example be used for assessing how much greenhouse gas is emitted to the environment during the production of one litre milk. The site is constructed as follows:
LCA
in general
Word explanation box
Making a LCA
Links to other relevant information on LCAs
In the following a description of the drawing of an LCA will be made according to the ISO 14040 series. ISO 14040 is an international standard for making LCAs. First the four phases in a LCA will be described exemplified by milk as a case and secondly the making of an LCA will be described in further detail. In the word explanation box an explanation of some of the words used is given.
The process of making an LCA can be divided into four phases according to ISO 14001:
- Phase 1: Definition of purpose, goal, functional unit and system boundaries
- Phase 2: Inventory analysis, including data collection for all processes (in- and output data) and allocation or system expansion between product and co-product.
- Phase 3: Evaluation of the environmental effects, Including calculation of the LCA results through classification and characterization.
- Phase
4: Interpretation of the result and identification of significant
issues.
To make an LCA is an iterative process where the four phases are repeated several times, this way the LCA result becomes more useful, credible and close to reality. The phases has to be reviewed several times because the more knowledge on a process gained through studying the product the more data and information can be taken into account in the LCA.
In phase 1 all general decisions concerning the making of an LCA is made. The functional unit can for example be 1 kg milk from the farm or 1 liter of milk from the supermarket. The system boundaries can for example start at the production of raw materials like fodder used at the farm and end where the milk leaves the store. Then in phase 2 the inventory analysis of the LCA is made. Phase 2 is a very resource-demanding phase because of the data collection. The life cycle of milk can contain major processes like: production of fertilizer and fodder, farming, production of the milk carton, the dairy, transport, cooling and much more. A simplified life cycle of milk can be seen in figure 1. To each of the processes on the figure there is an input, output of products and the discharge of emissions. The emissions can be greenhouse gasses, nutrifying and toxic substances. Life Cycle Assessment is a method to collect, summarize and interpret all these emissions.
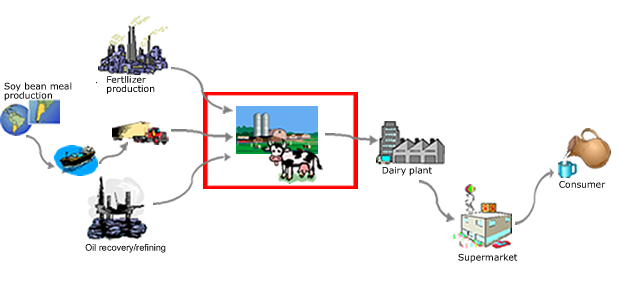
Figure 1: Simplified process diagram for the life cycle of milk. The figure is simplified compared to the real world, because the system would be too comprehensive to show here. A more detailed life cycle can be seen in the LCA Food database in SimaPro (Materials/scenario without milk quotas/food from supermarket/).
Result
of an LCA on Milk
The result of an LCA is an impact assessment of a product’s environmental
impacts in its life cycle divided into different categories like global
warming and acidification. The impact assessment for full milk is
showed in the table below.
Table 1: Characterized results from LCA on full milk the data are based on a scenario with no milk quotas in Denmark. In SimaPro it is possible to see which processes have been included in this life cycle. See the LCAfood database for similar data on other products. 'Farming' includes all inputs and outputs from the farming process, like the production of fodder and fertilizers. eq. = equivalents.
|
Impact category |
Unit | Total | Farming | Dairy | Whole sale |
Supermarket |
|
Global warming |
g CO2-eq. | 1140 |
1010 |
80 |
20 |
30 |
|
Acidification |
g SO2-eq. | 11 |
10.4 |
0.3 |
0.1 |
0.2 |
| Nutrient enrichment | g NO3-eq. | 53.1 |
51.4 |
1.1 |
0.3 |
0.3 |
| Photochemical smog | g ethene eq. | 0.40 |
0.29 |
0.02 |
0.03 |
0.06 |
| Land use | m2*year | 1.5 |
1.5 |
- |
- |
-
|
A company can use LCAs for several purposes:
- To give the company an overview of the environmental impacts internally, which gives the company foundation for making environmental improvements and thereby decreasing their environmental impacts.
- To put pressure on the company's suppliers to make more environmentally friendly raw materials.
- In marketing, where the company can market one or more of their products on its environmental profile or they can market their products compared to other similar products on the market.
- In product development phase, eco-design. In eco-design an LCA can be used for assessing the possible environmental impacts from a product that is under development. The LCA results can this way be used to change parameters in the product or the production here of.
In the following the principles and methods of performing an LCA will be described in further detail.
|
Functional
unit: The amount, weight and quality of the specific product
investigated. E.g. 1 kg milk |
Making
an LCA
When performing an LCA it is important and helpful to follow the international
standard ISO 14040-serie, especially when a company uses an LCA externally.
The ISO14040-series is available at DS
and ISO.
The ISO 14040-series contains seven standards:
- 14040: Principals and framework
- 14041: Goal, scope and inventory analysis
- 14042: Impact assessment
- 14043: Life cycle interpretation
- ISO 14047-14049 gives examples on impact assessment and inventory and rules for documentation.
In the bullets above four different areas have been marked. These areas are actually phases in making an LCA. In figure 2 below the phases have been illustrated.
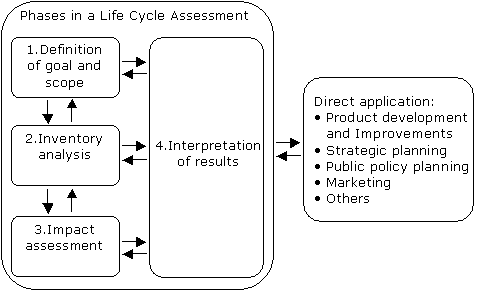
Figure 2: Phases in a Life Cycle Assessment
Making an LCA is an iterative process, where constant reviewing, improving and adding information and data are necessary. The results will this way become the best possible.
Phase
1: Definition of goal and scope
Phase 2: Inventory analysis
Phase 3: Impact Assessment
Phase 4: Lifecycle interpretation
Phase
1: Definition of goal and scope (ISO 14041)
Phase 1 is the beginning stage where goal and scope of the LCA is defined,
this include (ISO 14041):
- Goal, purpose and target group
- Product type and functional unit (quantity, quality and lifetime)
- Alternatives
- Time-related, technology and geographical coverage (e.g. 1 year, best available, Denmark)
- Other data requirements
- System description, boundaries and cut-off criteria
- Assumptions
- Define allocation or system expansion principals
- Environmental impacts categories
- Distribution procedures
- Data
collection and critical review strategy
Goal, purpose and target group define what the LCA should be used for and by whom. A functional unit is describes the product or service investigated in the LCA, like one litre lowfat milk for dairy. The system boundaries and a lot of general assumptions for making the LCA are set according to the goal of the LCA. Decisions should be made regarding which environmental impact categories should be included in the LCA and how the allocation of input and emissions between products and co-products should be made. The allocation can be economic allocation, mass allocation or system expansion.
When these
preliminary decisions and strategies are decided phase 2 of the LCA can
begin.
Phase 2: Inventory analysis (ISO 14041)
This phase is the most work intensive and time consuming of all the phases
in an LCA, this is mainly because of the data collection. The phase includes:
- Data collection, quantitative and qualitative data for every unit process in the process system
- Relate data to the functional unit
- Make continuous validation of the data
- Use allocation or system expansion where necessary
- Refine
system boundaries
Data
collection:
The data collection must be performed according to the functional
unit and system boundaries. The data that should be used is for all
the important processes within the system boundaries.
The data should include all inputs and outputs from the processes. Inputs are for example use of energy, water, materials etc. Outputs are the products and co-products. Emissions can be divided into four categories: air, water, soil and solid waste depending on what the emissions affect.
The data collection can be less time consuming if good databases are available and if customers and suppliers are willing to help gather data. A lot of databases with LCA data exist and they can normally be bought together with the LCA software. Data on transport, extraction of raw materials, processing of materials, production of normally used products like plastic; cardboard etc. and disposal can normally be found in an LCA-database. Data can also be collected through national statistics as done in the LCAfood database for the farming processes.
Data from the databases can be used for processes that are not product specific, like general data on the production of electricity, coal or packaging. For example in the LCA on milk from the store specific data is needed on the farming while general data from the databases can be used for the production of electricity and fertilizers.
System expansion and allocation:
In many processes more than one product is produced (joint production),
in such cases it is necessary to divide the environmental
impacts from the process between the products. It is not straightforward
to divide environmental impacts between the product
and the co-product, but with help from allocation or system expansion
it can be done. The choice between the two methods can have huge impacts
on the result of the LCA. The ISO 14040 –series suggest using system expansion
whenever possible and where it is not possible to use system expansion
allocation can be used instead.
Allocation of environmental impacts between the product and co-products can for example be performed from an economic or weight point of view. Allocation is a division of the environmental impacts according to how much the products costs/weights, e.g. if a product costs 60dkr and the co-product costs 40dkr, then the product is said to give 60% of the environmental impacts and the co-product 40% of the environmental impacts. The weight allocation is performed in the same way, just with weight data. In figure 3 a sketch of an economic allocation can be seen.
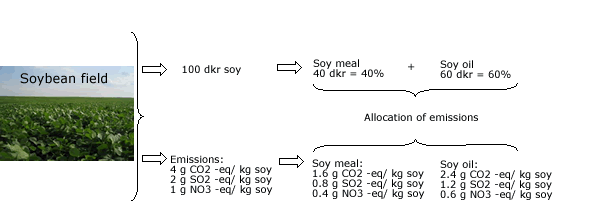
Figure 3: Example of allocation. eq. = equivalents.
In system expansion co-products are considered alternatives to other products on the global market as shown in the following example.
At a dairy farm milk is the main product and cattle meat is produced as a co-product. In such a production it is not possible to allocate precisely what feed use, land use, emissions etc. are related to for example milk vs. meat and therefor system expansion must be used. The cattle meat production replaces cattle meat from Argentina or pork meat on the market depending on the price of the Danish cattle meat, which means that there is an avoided production of Argentinean cattle meat or Danish pork and thereby a negative contribution to the environmental impact from milks lifecycle. In this example the system is then expanded to include the system of processes, which are involved in Argentinean cattle meat or the pork meat. See a sketch of system expansion in figure 4.
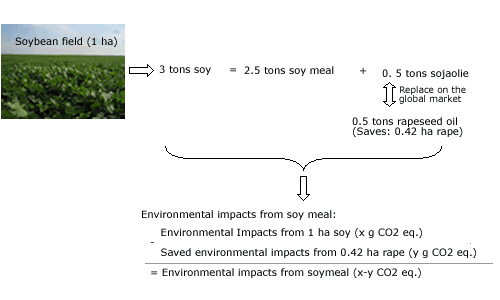
Figure 4: Example of system expansion. eq. = equivalents.
Identification of the marginal product can be made trough a marginal line of thinking, where the avoided product is a marginal product, which is the product that will be used more of if the production of the co-product decreases. Thorough the crediting the main product forms a system of products and avoided products.
Another example where system expansion is necessary is in flour. Grains are processed into flour and bran during the milling process. The environmental emissions associated with flour are determined by summarizing the total emissions associated with the milling process and subtracting the total emissions associated with the product that the marginal bran displaces in the market. Marginal bran is used for animal feed and is assumed to displace spring barley. Hence, the system of processes involved in analysis of flour is expanded to include the system of processes which are involved in spring barley production and the total emissions associated with flour is determined by subtracting the emissions associated with saved spring barley production from the emissions associated with flour and bran production. ¨
The two methods for dividing the environmental impacts between the main product and co-product (allocation and system expansion) is part of two methods for making LCAs. Allocation is part of the traditional attributional method. Attributional LCA seeks only to cut the piece of the global environmental impact related to the product. The goal is to describe the environmental relevant physical flow. Average suppliers data are used. System expansion is part of the consequential LCA method that seeks to capture change in environmental impact as a consequence of a certain activity and there by generate information on consequences of actions. Marginal data is used.
In the LCAfood database the consequential LCA method is used, this method is the most precise to use because it reflects reality and the market forces. The consequential method includes all processes that are affected by the production of a product e.g. the production of milk, where the production of meat is affected and there by included in the LCA as an avoided production. In attributional LCA the allocation is made based on the price or weight of the product and thereby the environmental impacts are not divided between the products according to the environmental reality but according to more or less arbitrary partitioning coefficients.
Phase
3: Impact Assessment (ISO 14042)
In this phase the collected data are processed and the actual result of
the LCA is given. The emissions of a product are divided into different
environmental impact categories. The result can
be presented in different ways, for example for the entire lifecycle or
for single parts of the lifecycle but always within the environmental
impact categories. An overview of phase 3 is given in figure 5 below
followed by a description of the different parts of the figure.

Figure 3: Classification and characterization
The figure shows on the left some of the processes within the lifecycle of one kilo cheese and the emissions from these processes. On the right side the environmental impact categories that the emissions contribute to can be seen. In the top right corner of the figure the co-products from the production of cheese are seen, these products will result in a system expansion of the life cycle.
The environmental categories are described in the following to give an overview of how each category affect the environment and which human activities contributes to this category.
Environmental impact categories:
- Global warming is a warming of the atmosphere, which causes climate changes. Some of the biggest human contributors to global warming are the combustion of fossil fuels like oil, coal and natural gas. Global warming potential are in the LCAFood database presented in g CO2-equivalents.
- Acidification is caused by acids and compounds which can be converted into acids that contributes to death of fish and forests, damage on buildings etc. The most significant man made sources of acidification are combustion processes in electricity and heating production, and transport. Acidification potentials are in the LCAFood database presented in g SO2- equivalents.
- Eutrophication also called nutrient enrichment causes algal bloom in inlets and springs causing oxygen depletion and death of fish. Emissions of nitrogen to the aquatic environment, especially fertilizers from agriculture contribute to eutrophication. Also oxides of nitrogen from combustion processes are of significance. Eutrophication potentials are in the LCAFood database presented in g NO3- equivalents.
- Photochemical smog formation occurs when Volatile Organic Compounds (VOC’s) are released in the atmosphere and oxidized in the presence of oxides of nitrogen (NOx). The most significant VOC’s emissions from unburnt petrol and diesel and the use of organic solvents, like paints. Photochemical smog attacks organic compounds in plants, animals and materials exposed to air, causing problems in the respiratory tract in humans. For agriculture it causes a reduction in yield. Photochemical smog formation potentials are in the LCAFood database presented in g ethane equivalents.
- Ozone depletion: Stratospheric ozone is broken down as a consequence of man-made emissions of halocarbons (CFC's, HCFC's, haloes, chlorine, bromine etc.). The ozone content of the stratosphere is therefore decreasing and thinning of ozone layer, often referred to as the ozone hole. The consequences are increased frequency of skin cancer in humans and damage to the plants.
- Land use: Area of land used in the production of a product, for example agricultural land. Land use is presented in hectare year (ha*yr) or in m2*yr.
Toxic impact
categories also exist; these are not described here. It is difficult to
get valid result within the toxic categories because it is difficult to
get useful and precise data on the processes that contribute to toxic
categories. This can for example be on production of chemicals.
Calculations in a LCA (five steps):
In phase 3 the result of a LCA is given through five calculation steps, these are:
- Classification: Review of the inventory deciding to which impacts categories the emissions contribute, e.g. global warming.
- Characterization: Calculation of the emission’s potential environmental impact is done by using equivalence factors specific for each impact category, see figure 3. This way different substances emitted can be transformed into the same unit. For the global warming the reference is for example normally CO2.
- Normalization (PE): In normalisatin the environmental impacts are seen in relation to an average danish persons contribution to the environmental effect during a year. This means that normalisation is a relative magnitude of the potential impacts and resource consumptions. The environmental impacts from the characterization are compared with an impact, which is common for all impacts categories and of which the consequences for the environment, resources and working environment are known. In the EDIP method, which is used in the LCA food database, the resource consumption and the potential impacts which society imposes on the environment each year are used for the comparison. The unit is impact potential per person per year.
- Weighting (e.g. wPE value choices), the environmental impacts form the normalization is compared to the political reduction goals. The seriousness of the impacts categories relative to one another is made. Weighting ables a comparison of the potentials for the various impacts.
- Sensitivity
analysis, estimation on how much the results can vary. The sensitivity
analysis covers the product system model, the processes and the assessment
factors.
In the LCAfood database the data has only been classified and characterized, examples of characterized impact potentials from full milks lifecycle can be seen in table 1. It is up to the user of the LCAfood database to perform the normalization them self. It is in most cases not advisable to weight the result because of many uncertainties with the weighting, caused by the politically set reduction goals.
Phase
4: Lifecycle interpretation (ISO 14043)
Phase 4 is performed through each of the other steps in the LCA to ensure
the quality of the LCA. The phase include:
- Analyze results: Identification of significant issues
- Evaluation: Completeness, sensitivity and consistency checks (quality check)
- Reach conclusion and explain limitations
- Provide
recommendations
Analyze
results:
In this phase the results from the Life cycle are analyzed according to
the decisions made in Phase 1 about scope of the LCA. In table 1 the environmental
impacts from full milks lifecycle are shown, the impacts are divided into
some of the major phases in milks life cycle. It can be seen that the
biggest contributor in all the impact categories is the farming. Farming
also includes the production of fodder, electricity, fertilizers etc.
used in the farming process.
The LCAfood database meets the demands in the ISO 14040-series, this with the assumption that the system expansion has been performed with the right processes and thereby that the avoided processes are correct. The LCAfood database is the first database using system expansion systematically, which is suggested as first priority in the ISO 14040-series, allocation is second.
Links
to other relevant information on LCAs:
Wenzel H, Hauschild M and Alting L (2001): Environmental Assessment of
Products, Volume 1: Methodology, tools and case studies in product development,
ISBN 0-412-80800-5, Institute for Product Development
Dansk Standard (2001): Livscyklusvurderinger – en kommenteret oversættelse af ISO 14040-14043, 1. udgave, ISBN 87-7310-270-9, DS håndbog 126 (In Danish and English)
Ekvall, T. and Weidema, B. P. (2004): LCA Methodology, System Boundaries and Input Data in Consequentioal Life Cycle Inventory Analysis, International Journal LCA 9 (3), p 161-171.
Weidema B (2003). Market information in life cycle assessments. Technical report, Danish Environmental Protection Agency (Environmental Project no. 863).
Weidema B (2001). Avoiding co-product allocation in life-cycle assessment. Journal of Industrial Ecology, 4(3), 11-33.
Weidema BP (1999). System expansions to handle co-products of renewable materials. Presentation Summaries of the 7th LCA Case Studies Symposium SETAC-Europe, 1999. Pp. 45-48. pdf.
Wenzel H, Hauschild M and Alting L (1997). Environmental assessment of products. Volume 1. Methodology, tools and case studies in product development. Chapman and Hall.
Widheden, J., Ekvall, T. and Nielsen, P. H. (1998). Lifecycle assessment of packaging systems for beer and soft drinks - disposable bottles (Technical report no. 2). Miljøprojekt no. 401 Danish Environmental Protection Agency.