Bread (Brød)
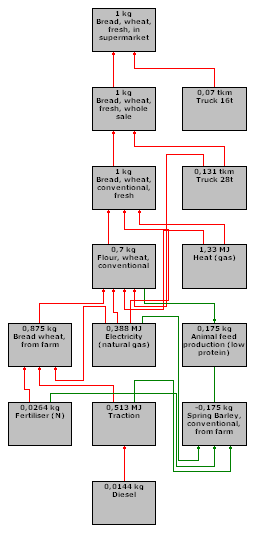
Bread is produced by baking a dough made of flour and water and a number of other ingredients. The main processes influenced by a demand for bread are shown in the figure below, exemplified by fresh wheat bread ex retail.
|
|
| Figure 1:Market based product chain diagram for fresh wheat bread ex retail covering the most important processes in terms of contribution to global warming. Boxes refer to production processes. Names of grey boxes refer to the main product of the processes. Red arrows represent material or energy transfer between two processes; green arrows represent saved material or energy transfer as a result of displacements; green lines represent displacements and red lines represent avoided displacemements. Further details can be found in the LCA model. |
The bread is baked in an industrial bakery using electricity for mechanical operations and light and natural gas for heating the oven etc. Flour for baking is coming from a mill where wheat from agriculture is milled into flour. The bran produced during the process is used for animal feed, displacing spring barley (see flour).
The tables below show potential environmental impacts associated bread demand ex industrial bakery and ex retail. The weight of rolls is 60 g per unit, the weight of white bread is 175 g per unit and the weight of rye bread is 500 g unit. All data are provided per kg of bread.
Rolls (fresh)
| Impact category | Unit | Ex. bakery | Ex. retail | ||
|
Conventional |
Organic | Conventional | Organic | ||
| Global warming | g CO2-eq. | 880 | 930 | ||
| Acidification | g SO2-eq. | 4.7 | 5.1 | ||
| Nutrient enrichment | g NO3-eq. | 59 | 59 | ||
| Photochemical smog | g ethene eq. | 0.19 | 0.29 | ||
| Landuse | m2 year | 0.98 | 0.98 | ||
| Location in database: Material/Food from industry/Bakery and mill/ and Material/Food from supermarket/Others/ |
Rolls (frozen)
| Impact category | Unit | Ex. bakery | Ex. Retail | ||
| Conventional | Organic | Conventional | Organic | ||
| Global warming | g CO2-eq. | 890 | 1260 | ||
| Acidification | g SO2-eq. | 4.7 | 5.4 | ||
| Nutrient enrichment | g NO3-eq. | 59 | 60 | ||
| Photochemical smog | g ethene eq. | 0.20 | 0.32 | ||
| Land use | m2 year | 0.98 | 0.98 | ||
| Location in database: Material/Food from industry/Bakery and mill/ and Material/Food from supermarket/Others/ |
Wheat bread (fresh)
| Impact category | Unit | Ex. bakery | Ex. retail | ||
| Conventional | Organic | Conventional | Organic | ||
| Global warming | g CO2-eq. | 780 | 840 | ||
| Acidification | g SO2-eq. | 4.6 | 5.0 | ||
| Nutrient enrichment | g NO3-eq. | 59 | 59 | ||
| Photochemical smog | g ethene eq. | 0.18 | 0.27 | ||
| Landuse | m2 year | 0.98 | 0.98 | ||
| Location in database: Material/Food from industry/Bakery and mill/ and Material/Food from supermarket/Others/ |
Wheat bread (frozen)
| Impact category | Unit | Ex. bakery | Ex. Retail | ||
| Conventional | Organic | Conventional | Organic | ||
| Global warming | g CO2-eq. | 720 | 1200 | ||
| Acidification | g SO2-eq. | 4.6 | 5.3 | ||
| Nutrient enrichment | g NO3-eq. | 59 | 60 | ||
| Photochemical smog | g ethene eq. | 0.18 | 0.30 | ||
| Land use | m2 year | 0.98 | 0.98 | ||
| Location in database: Material/Food from industry/Bakery and mill/ and Material/Food from supermarket/Others/ |
Rye bread (fresh)
| Impact category | Unit | Ex. bakery | Ex. retail | ||
| Conventional | Organic | Conventional | Organic | ||
| Global warming | g CO2-eq. | 720 | 790 | ||
| Acidification | g SO2-eq. | 4.6 | 4.9 | ||
| Nutrient enrichment | g NO3-eq. | 53 | 54 | ||
| Photochemical smog | g ethene eq. | 0.21 | 0.29 | ||
| Land use | m2 year | 1.3 | 1.3 | ||
| Location in database: Material/Food from industry/Bakery and mill/ and Material/Food from supermarket/Others/ |
